

Elliott Wave Theory
Technical Analysis Indicators & Strategies • 13 min
“The MACD is one of the most popular momentum indicators, as it provides a simple and effective way to identify the strength of a trend and potential reversal points,” said John J. Murphy in “Technical Analysis of the Financial Markets.”
This versatile indicator is applied in various strategies utilised by both newbies as well as more advanced professional traders.
What are the MACD advantages? How can you set it up and make use of it in your trading?
MACD is an oscillator, although it’s often called a trend indicator or even a “trend oscillator”. It happens because MACD is based on two moving average indicators applied directly on the chart (they are not displayed in the MACD chart, only their readings are used). MACD itself is displayed in a separate window under the chart. It looks like a histogram with an auxiliary line. The histogram shows that divergence of two moving averages. If one of them moves away from the other, the histogram bars become longer; If the moving averages get closer, the bars become shorter.
Thus, rapid movements will result in long bars in the MACD histogram, and flat will be indicated by short bars.
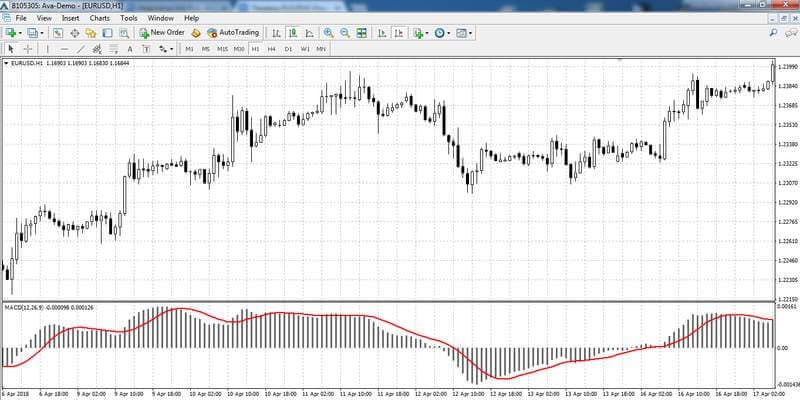
If the histogram is above the zero line it means that the fast moving average will be rising above the slow one, gradually moving away from it, which indicates an uptrend. If the bars go below the zero line and the fast-moving average is below the slow one, it’s a downtrend. The auxiliary line, which sometimes intersects with the histogram in the indicator window, is the moving average that has been calculated based on the MACD histogram readings and not the price chart.
This line is designed to receive additional signals from the indicator. To avoid any confusion, let us call it a “MACD moving average”.
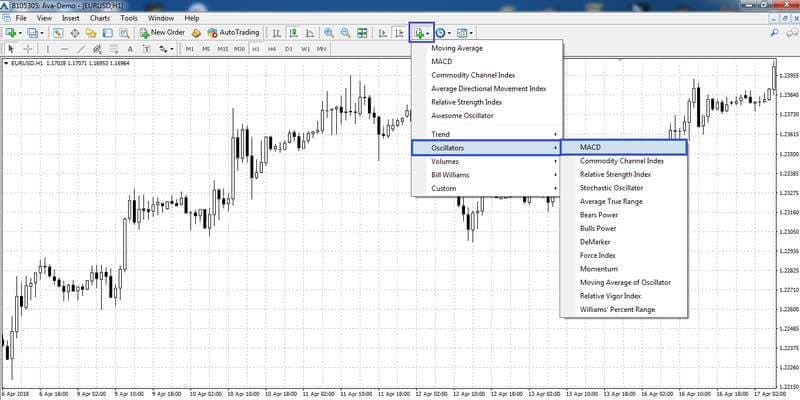
MACD is among the standard tools of MetaTrader 4 and MetaTrader 5, and the set up is done in just a few clicks.
The easiest way to do that is via the “Indicators” section in the platform’s upper menu:
After that, the window with indicator settings will open:
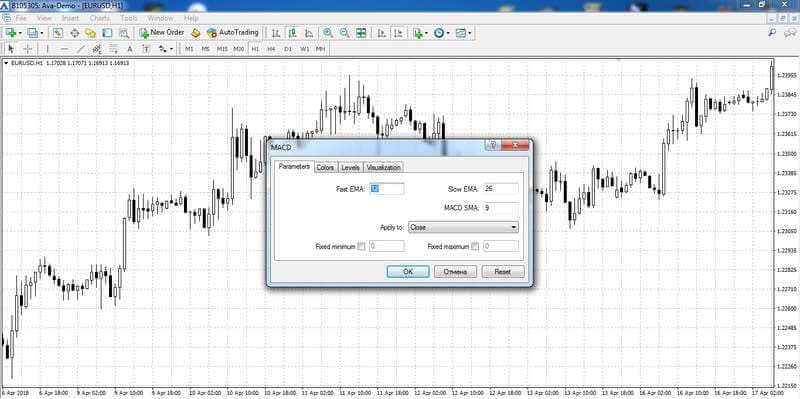
Here you can set the main parameters of the indicator:
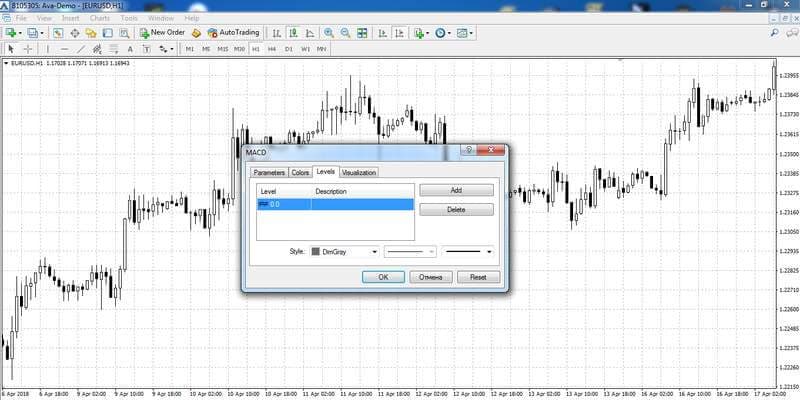
Other tabs will allow you to set the colour range, change the timeframe or add levels that are a straight line on an indicator (it’s set to “0” by default). Additional levels might be required by a certain strategy for tracking the signals. For example, selling of an asset at the intersection of the top level on the chart.
Once the indicator has been set up and applied to the chart, you can start trading. There are both simple and more complex MACD trading strategies. To understand the MACD principle, let us look at some of these strategies.
The simplest MACD strategy does not require any additional indicators. MACD signals alone will be sufficient for determining the entry points. With this strategy, the orders are opened as follows:
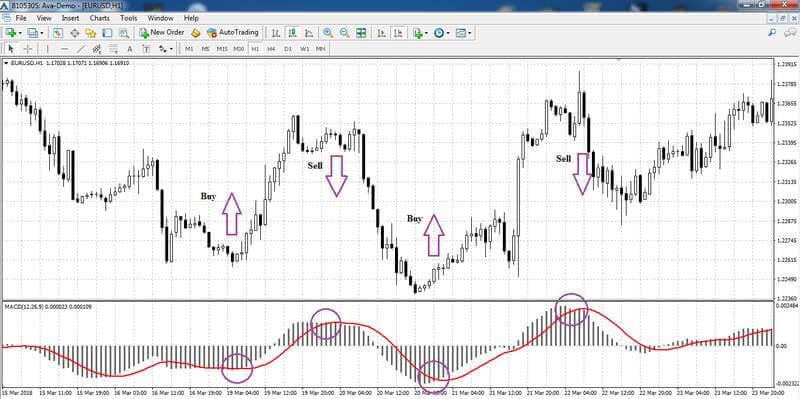
The recommended stop loss level is set below the minimum level of the candlestick that determines the entry point (when buying) and is above the maximum level when selling. The take profit should be three times the stop loss or at the closest key price level.
A quote by Barbara Rockefeller in “Technical Analysis: A Beginner’s Guide” goes like this: “One of the main advantages of the MACD is its ability to alert traders to the potential for a trend reversal before it becomes obvious.”
The discussion revolves around using the MACD to spot potential reversals in fast-moving markets, particularly during sharp price fluctuations. This is achieved by using the MACD convergence/divergence technique.
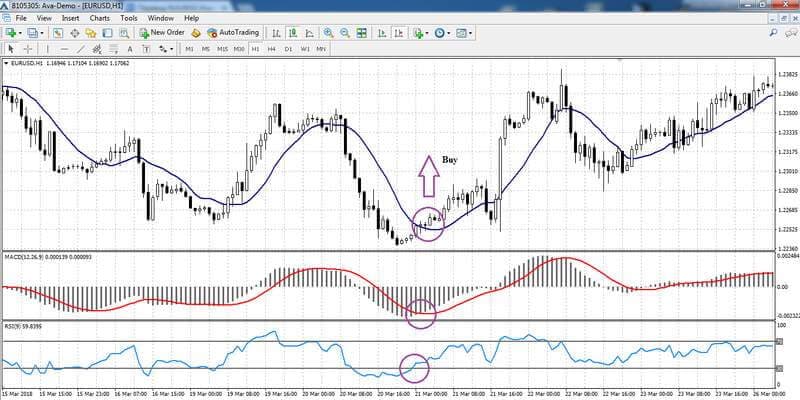
An MACD convergence/divergence signal is one of the strongest ones. Convergence is expressed by the histogram shrinking (as shown below), whereas divergence shows the MACD histogram expanding in either direction. Convergence is a signal of a trend whose momentum is fading, whereas divergence is a signal of a trend gaining momentum.
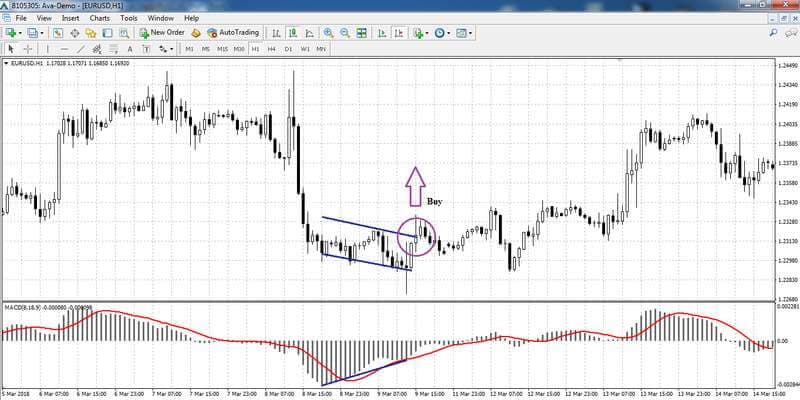
The chart shows how the price movement slowed down after a strong downtrend, reversed and then went down again, hitting a fresh low. At the same time, MACD also shows a local minimum, but it is higher than the previous one. This signals that the movement is “exhausted” and it’s highly likely that the price will go upwards. Although it is now shown in the chart itself, the indicator signals in advance, which is exactly what makes it valuable.
Convergence trading is conducted in the following way:
Divergence differs from convergence in that the lines in the chart and at the top of the histogram do not converge but move in different directions (the chart line goes upwards whereas the line in the indicator window moves down).
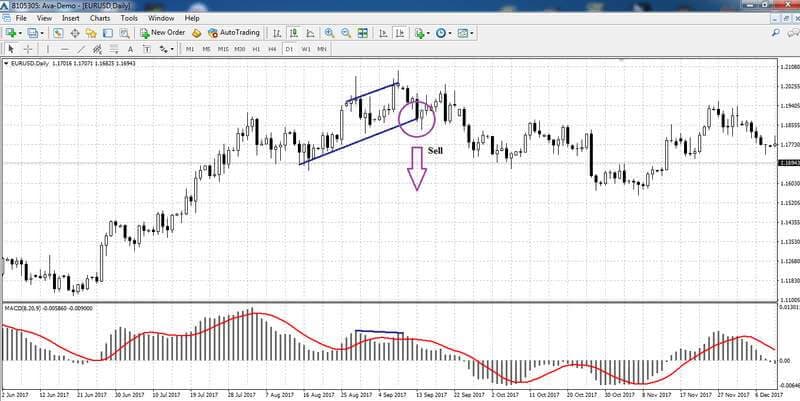
In this case, if the price breaks the price channel support line, the sell order will be open.
To make trading more efficient, you can use other indicators together with MACD. The best option to complement the MACD oscillator would be a trend indicator. The most effective and simple one would be МА. The buy and sell signals will then be as follows:
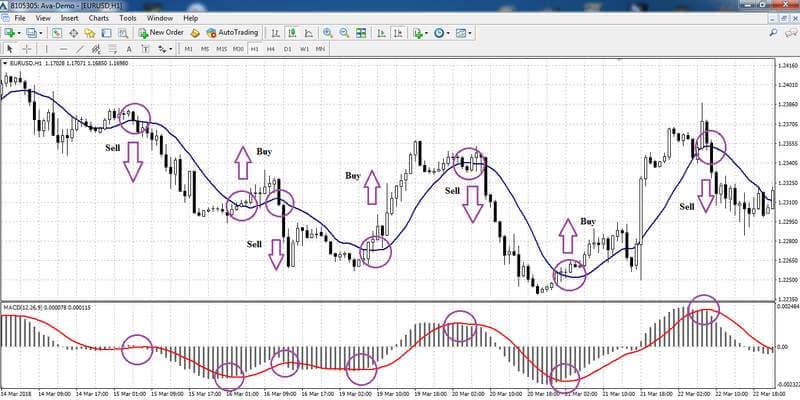
There are fewer false entry points because the indicators filter each other’s signals. Although this system can also result in losses, they are compensated by bigger profits due to the strong trend.
The “the more indicators, the better” rule does not always work. However, technical analysis experts agree that the charts can have up to five indicators. We will look at the strategy with three indicators: MACD, MA and the RSI oscillator. In this case, it is quite appropriate to use two oscillators. While MACD will help determine the order opening direction, RSI will determine the optimum entry points. It will allow not only to enter the market in the correct trend direction but also take maximum profit. You can opt not to open the position if the trend started weakening and you missed the chance.
The complex strategy allows us to buy under the following conditions:
If the situation is reversed, the sell orders will open. In this case, RSI will act as a powerful filter that will prevent late market entry. At the same time, MA and MACD will be filtering the false entries to the RSI oversold and overbought zones.

By following these quick tips, traders can improve their effectiveness when using the MACD indicator, enhancing their overall trading strategy.
The Moving Average Convergence Divergence (MACD) is a lagging indicator used to locate trends within the market. It consists of a histogram and two lines derived from moving averages. It is important to note that the moving averages used are exponential, and thus will give greater weight to more recent price action. This helps traders identify whether a trend is getting stronger or weaker based on the slope of the MACD lines. The histogram simply shows the difference between the two lines, giving a visual representation. Thus the histogram is positive when the faster EMA line is on top and is negative when the faster EMA line is on the bottom.
Each trader has their own preferred MACD settings, but in general, it is agreed that the best settings for day trading using the MACD are 3-10-16 and 5-34-1. That said, it is important to recognize that the MACD is a lagging indicator and really needs to be combined with another indicator to truly shine. Some popular combinations are the MACD with the MFI or TRIX, but the most popular combination is MACD with Bollinger Bands. All of this is to say that the settings for the MACD are important, but there are other considerations that will be of greater help when creating a successful day trading strategy.
The best MACD trading strategy is the one that works best for you, and this will differ based on the psychology and trading strategy of each individual trader. That said, there are a number of indicator combinations that work well with the MACD. One such is the MACD plus the MFI. This combines the crossover from the MACD with the overbought/oversold signals from the MFI. So, if the MFI gives a signal that an asset is overbought, we simply wait for a bearish cross in the MACD and then go short. It works the same for oversold signals and going long. The exit signal is when the MACD crosses in the other direction.
The MACD indicator can be very helpful for trading based on technical analysis. However, it is not very efficient without other tools. Together with two or three appropriate indicators, MACD will create a system with positive ratio between good and false entry points. This will ensure profit for the disciplined traders.
You can test these strategies for free with an AvaTrade demo account.
Trading in the financial markets is associated with high investment risks. To level them out, it is necessary to follow the money management rules and set the stop loss. Traders make all the decisions in the Forex market at their own risk. We recommend you to visit our trading for beginners section for more articles on how to trade Forex and CFDs.
Technical Analysis Indicators & Strategies • 13 min

Technical Analysis Indicators & Strategies • 13 min

Technical Analysis Indicators & Strategies • 12 min

Technical Analysis Indicators & Strategies • 15 min

Technical Analysis Indicators & Strategies • 10 min

Technical Analysis Indicators & Strategies • 11 min

Technical Analysis Indicators & Strategies • 15 min

Technical Analysis Indicators & Strategies • 13 min

Technical Analysis Indicators & Strategies • 15 min

Technical Analysis Indicators & Strategies • 15 min

Technical Analysis Indicators & Strategies • 13 min

Technical Analysis Indicators & Strategies • 12 min

Technical Analysis Indicators & Strategies • 11 min

Technical Analysis Indicators & Strategies • 13 min

Technical Analysis Indicators & Strategies • 20 min

Technical Analysis Indicators & Strategies • 10 min

Technical Analysis Indicators & Strategies • 13 min

Technical Analysis Indicators & Strategies • 18 min

Technical Analysis Indicators & Strategies • 8 min

Technical Analysis Indicators & Strategies • 12 min