
Leading and Lagging Indicators
Technical analysis tools fall into two broad categories: leading and lagging indicators. Visit the AvaTrade education section and learn more. Click here!
Intermediate • 17 min
Trading strategies that will help you to pick out and exploit the best opportunities.
Technical analysis tools fall into two broad categories: leading and lagging indicators. Visit the AvaTrade education section and learn more. Click here!
Intermediate • 17 min

What is Relative Strength Index? ⭐ Learn the best RSI Trading Strategies from our complete guide. ⭐ Signals, setups & trading tips.
Beginner • 14 min

The Average True Range (ATR) is a common technical analysis indicator designed to measure volatility. ⭐ Learn how to use it for trading.
Intermediate • 20 min
Support & resistance levels illustrate how the supply & demand forces interact to determine the prevailing price of an underlying asset.
Beginner • 14 min

Average Directional Movement Index (ADX) is a technical analysis tool used by traders to establish trend strength as well as trend direction.
Intermediate • 15 min
Elliott Waves describe how the collective psychology & sentiment of market participants drive the demand & supply of underlying assets.
Intermediate • 13 min
Parabolic SAR is an indicator that is used to forecast the short term momentum of an asset and to determine a stop loss level. ⭐ Read more.
Intermediate • 13 min

The Aroon indicators are a type of momentum oscillator that was developed in 1995 by Tushar Chande. ⭐ Learn how to use it here.
Intermediate • 12 min
Master Donchian Channel settings, back tests and risk tips. Spot true breakouts and trade smarter with AvaTrade’s step by step guide.
Intermediate • 10 min
TRIX is a powerful indicator suitable for both trending and ranging markets. ⭐ It provides information on trend direction and its strength.
Intermediate • 11 min
Bill Williams has developed his own proprietary indicators that are now extremely popular and available on most trading platforms.
Intermediate • 15 min
Learn how to use the ROC indicator for effective momentum trading. Discover setup strategies, risk controls, and back-tested insights with AvaTrade.
Intermediate • 13 min
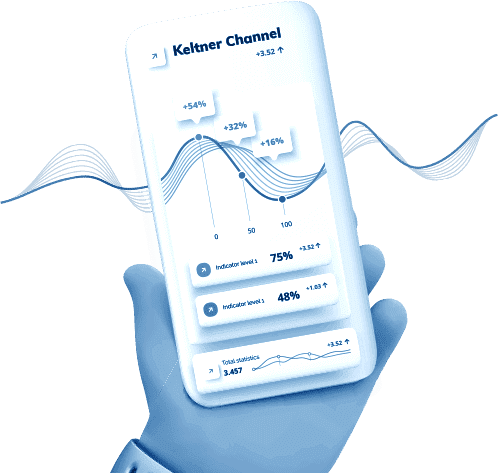
The Keltner Channel is a volatility-based envelope indicator similar to the popular Bollinger Bands. ⭐ Learn about its features here!
Intermediate • 15 min
The Money Flow Index (MFI) is a technical analysis indicator that allows traders to ‘follow the money’. ⭐ Learn how to use it.
Intermediate • 15 min
Master RVI trading with our expert strategies, risk tips, and comparisons. Learn to avoid false signals and trade smarter with AvaTrade.
Intermediate • 13 min
Awesome Oscillator is based on a combination of moving averages and is valued for the clear and straightforward trading signals it generates.
Intermediate • 12 min
Ichimoku Cloud helps traders to pick out trading opportunities in trending markets, establish price momentum, & resistance price zones.
Intermediate • 11 min
Pivot Points are used to map out support and resistance zones. ⭐ Learn how to use this indicator for trading Forex and CFDs.
Intermediate • 13 min
Learn MT4 indicators with examples, comparisons & FAQs. Discover how to trade smarter with RSI, MACD, Bollinger Bands & more on AvaTrade MT4.
Beginner • 10 min
Learn how to trade harmonic patterns with precision using MT4/MT5 tools, proven ratios, and risk management strategies from AvaTrade.
Intermediate • 13 min
Discover how to use Dow Theory for trend analysis, volume confirmation and risk management on AvaTrade. Learn strategies with real examples.
Beginner • 18 min
Master Heikin Ashi charts with AvaTrade. Learn setups, limitations, and strategies for scalping, swing, and trend trading.
Intermediate • 8 min
Learn how to trade with Renko charts — from brick sizing to strategy confirmation. Get expert tips, avoid pitfalls, and test setups with AvaTrade.
Intermediate • 12 min
Learn the Kelly Criterion for position sizing, how to estimate win rate and payoff, and why fractional Kelly can reduce drawdowns for traders.
Intermediate • 16 min
Learn to analyze stock charts, use indicators, and apply trading strategies. Practice risk-free with an AvaTrade demo account today!
Intermediate • 10 min

By cancelling out the noise, Moving Averages reveal the trend, but there’s a lot to be learned when we combine different timeframes.
Beginner • 6:16 min
The battle between technicians & fundamentalists is oft worthy of a soap operatic epic saga ⭐ How important are the motivating forces?
Beginner • 1:59 min
Where physics & finance come together is in the simple notion that the higher an object’s momentum, the more force is required to sway it
Intermediate • 3:13 min
Why does technical analysis work? ⭐ Is it because markets are created by individuals ⭐ each with his/her own fears and lusts?
Beginner • 8:02 min
Just below the chart lies the oscillator, & this one can tell us if an asset is overbought or oversold – an excellent piece of information.
Beginner • 7:58 min
Contrary to its name, the Moving Average Convergence Divergence Indicator is not really that hard to master ⭐ Learn how..
Beginner • 6:16 min
How one Italian mathematician in the Middle Ages saw a pattern in snail shells & earned his place in financial history???
Beginner • 5:12 min
Complex candlestick patterns contain so much information, it’s hard to imagine it all exists on a 2-dimensional readout ⭐ Video Tutorial ⭐
Beginner • 5:16 min
The simplest candlesticks tell us how much action, in what direction, & if a trend is about to change ⭐ all in one double-wicked blob.
Beginner • 7:29 min
once you see the Trend Lines, all that’s left is to decide if you intend to follow it or wait for its reversal ⭐ Video for beginners.
Beginner • 6:56 min
Prices move in patterns. Study the pattern and what’s behind it, and you’re half way there...➤ Video Tutorial for beginners.
Beginner • 3:10 min

Money goes around in circles ✅ some have it, some need it; and based on the circular nature of supply & demand, currency prices orbit.
Beginner • 3:05 min
Samurai class rice merchants these oblong coloured balloons offer a wealth of information ⭐ often sufficient in themselves to predict ...
Beginner • 4:17 min

Learn the basics of price charts patterns analysis. ⭐ Continuation & reversal patterns recognition for price action traders.
Beginner • 27 min

What are Japanese candlesticks, which candlestick patterns exist, how to identify them & how to trade their setups. ⭐ Learn it all here !
Beginner • 18 min

What are Fibonacci levels? ⭐ Learn about the technical analysis indicators based on Fibonacci sequence. ⭐ Examples included !
Beginner • 13 min

Read how to install and use MACD indicator in online trading. ⭐ Types of MACD settings, parameters and signals. ⭐ Learn more !
Beginner • 11 min
Install & use Moving Averages Indicator in online trading. ⭐ Types of MA indicator settings, parameters & signals. ⭐ Learn more !
Beginner • 14 min
How to install the Commodity Channel Index on MT4 & how to interpret its signals. ⭐ Read about more complex trading strategies based on CCI.
Beginner • 18 min
Master Stochastic trading with strategies, tips & FAQs. Learn combinations, adaptive settings, and avoid mistakes — trade smarter with AvaTrade.
Beginner • 11 min

Discover how to backtest and optimise the Bollinger Bands Strategy for Forex, equities, and crypto with AvaTrade. Trade smarter today!
Beginner • 16 min
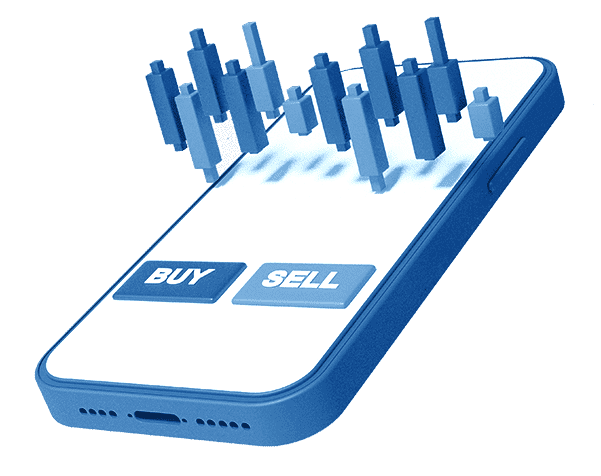
You’ve just seen how different technical indicators and strategies work in theory. Now it’s time to turn them into a simple plan you can actually follow. Indicators help you read the chart; a strategy tells you how to act on that information.
Clear technical rules do three important things for you: they reduce guesswork, help you stay consistent from trade to trade, and give you a way to judge your results over time instead of reacting to every price move.
When you decide in advance what will trigger an entry, where you will place your stop loss, and how you will take profits, you move from one-off decisions to a repeatable process.
Instead of trying to trade every pattern you see, build a small, focused playbook you can repeat. A good starting point is:
Decide how often you can look at the charts.
Start with a single, liquid market – for example a major FX pair, a main stock index, or a leading commodity. Focusing on one instrument at first makes it easier to learn its “personality” and avoid spreading your attention too thin.
Use the indicators you have learned as building blocks:
Write rules you can explain in a few lines, for example:
Keep a simple journal noting the setup, entry, stop, target, and outcome. This turns each trade into a small piece of feedback on your rules, not just a win or loss.
Once you have a basic playbook, the next step is to see how it behaves in real market conditions – without rushing into full-size live trades.
Use your AvaTrade demo account to run through a fixed sample of trades – for example, 20–30 setups that match your rules. Treat each demo trade as if it were real: enter where your rules say, place the stop where you planned, and log the result in your journal.
When you look back over your sample, focus on questions such as:
If you decide to refine your strategy, change one element at a time – for example, adjust your stop-loss distance or tighten your entry filter.
Test the updated version on another batch of demo trades to clearly see whether the change improves your results.
When you are ready to trade live, start with smaller position sizes and the same rules that worked for you in demo. Avoid the temptation to suddenly add more indicators or chase every signal now that real money is at stake.
These steps are for educational purposes and cannot remove trading risk, but they can help you make more structured decisions and avoid trading on impulse.
Test your technical playbook in an AvaTrade demo account, refine your rules step by step, and only then consider applying them with real capital.