

Elliott Wave Theory
Technical Analysis Indicators & Strategies • 13 min
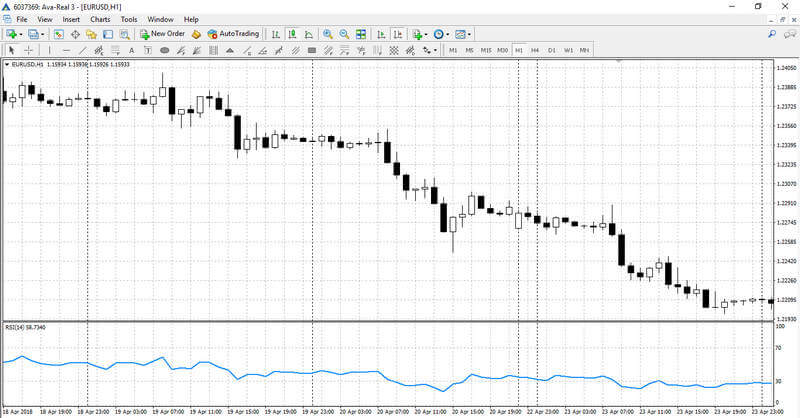
The Relative Strength Index (RSI) is a popular momentum indicator in technical analysis., helping traders evaluate the strength and speed of price movements. Developed by J. Welles Wilder in the late 1970s, the RSI measures the magnitude of recent price changes to assess whether an asset is overbought or oversold. It is displayed as a line graph that moves between two extremes, 0 and 100 and is often used to identify potential reversals in market trends.
RSI is calculated using the following formula:
RSI = 100 – [100 / {1 + (Average of Upward Price Change / Average of Downward Price Change}]
where RS (Relative Strength) is the ratio of the average gain to the average loss over a specific period, such as 14 days. A higher RSI value suggests that an asset is gaining strength, while a lower value indicates that its price momentum is weakening.
RSI values are typically used to identify overbought and oversold conditions. A reading above 70 suggests that the asset may be overbought and could be due for a downward correction. On the other hand, a reading below 30 indicates that the asset may be oversold, signalling a potential upward reversal.
The RSI is most effective in range-bound markets, where prices move between support and resistance levels. In such markets, RSI helps traders spot overbought and oversold conditions, which can indicate potential reversals. However, in strong trending markets, RSI may produce false signals, as it can remain in overbought or oversold territory for extended periods without a reversal occurring. Traders must, therefore, consider the overall market context when using RSI to time their trades.
There are two ways to set up this indicator. The easiest way is to click the tab ‘List of Indicators’ located on the upper panel of the terminal and select ‘Oscillators’ – ‘Relative Strength Index’.
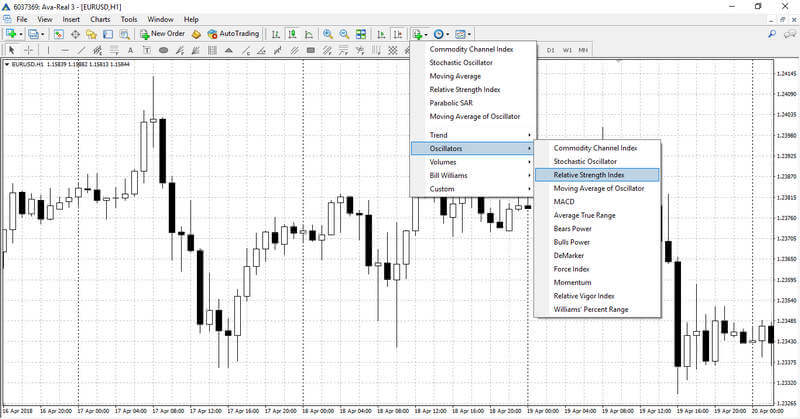
Another option is to choose ‘Insert’ – ‘Indicators’ – ‘Oscillators’ – ‘Relative Strength Index’.
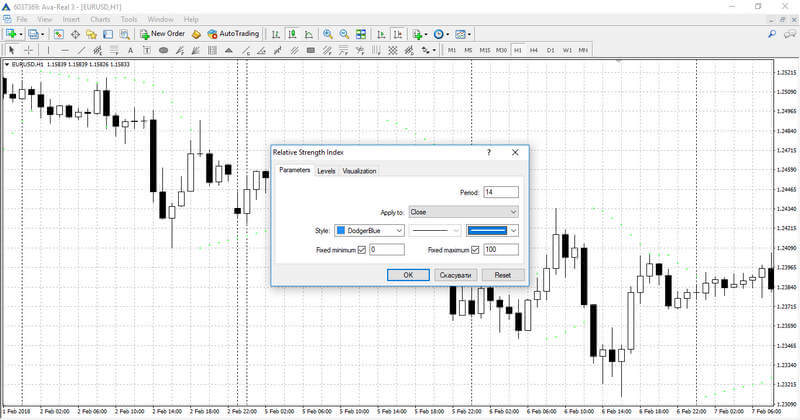
Instrument configuration window will open before the indicator is set in the chart. This window allows you to configure the indicators parameters. The main parameter is the period; It defines the number of price values taken into consideration at plotting the main indicator’s line. The shorter the period, the steeper indicator’s chart movements will be. This parameter is set to 14 by default, and this setting is considered optimal in most cases. You can also adjust the style settings, like line colour and weight. By using another tab of configuration window, you can change parameters of the levels from 30 and 70 to 20 and 80. You can also add new levels should your trading strategy require so.
The Relative Strength Index (RSI) is a versatile tool that can be used in multiple ways to identify trading opportunities. Whether you’re looking for entry and exit points or trying to confirm market trends, the RSI can help you make informed decisions. Below are three key ways to use the RSI effectively:
One of the most common uses of the RSI is identifying overbought and oversold conditions.
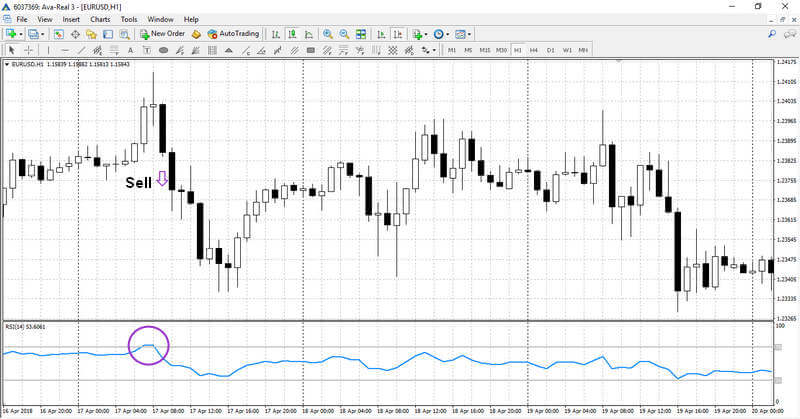
These signals are particularly useful in range-bound markets. In such markets, traders look for overbought signals in resistance areas and oversold signals in support areas. However, in trending markets, these levels can remain overbought or oversold for extended periods, so it’s important to use the RSI in conjunction with other indicators.
RSI divergences occur when the price of an asset moves in the opposite direction to the RSI, signalling a potential trend reversal. There are two main types of divergences:
Divergences are particularly powerful in identifying trend reversals, especially when they occur near overbought or oversold levels. They serve as early warning signals that the current trend may be losing strength.
Swing rejections are another useful RSI-based strategy, particularly when looking for trend reversals. This strategy involves four steps:
Swing rejections offer a structured approach to spotting potential reversals before they fully develop. They are particularly useful because they can help traders get in on medium-term swing trends from the very beginning.
The MACD (moving average convergence divergence) indicator is very popular because of its simplicity and ease of application, as well as its graphical appeal. MACD is a trend following and momentum indicator, used to determine when the price trend is accelerating or decelerating. Because the MACD uses moving averages in its computation, it is largely a lagging indicator and can be used to qualify trading signals generated by the RSI indicator, a leading indicator. For instance, if the RSI displays a reading of above 70, which implies overbought conditions in the market, a sell position can be initiated when the MACD series shifts from positive to negative (crossing below the 0 centreline).
Bollinger Bands is a volatility indicator whose bands squeeze when there is low volatility but diverge when there is high volatility. Periods of consolidation are usually followed by massive breakouts, which makes any Bollinger Bands squeeze a vital time to watch the markets. A breakout signal will be delivered when there is an RSI overbought or oversold failure swing. For instance, a bearish signal happens when the RSI line rises above 70 and then falls below 70 again. You could open a sell position when the prices touch the lower Bollinger band.
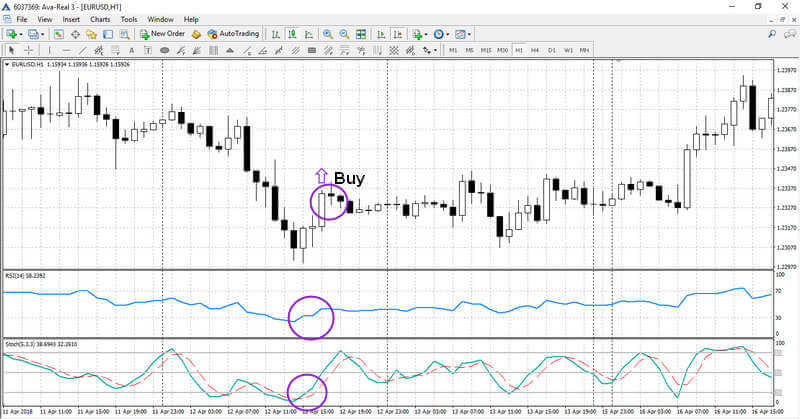
In order to boost trading efficiency, it’s best to use the Stochastic Oscillator. The absence of trend indicators in this trading strategy is compensated by simultaneous analysis of two timeframes. This way the oscillators will filter each other’s signals and trades will be opened only when both indicators give the same signals on different time frames. This strategy suggests using time frames of Н4 and М15. In Н4, the RSI will have the default settings. The only difference will be that instead of levels 30 and 70 we will set it at 50. In М15, Stochastic will have default settings.
Short position (Sell) will be opened in the following case:
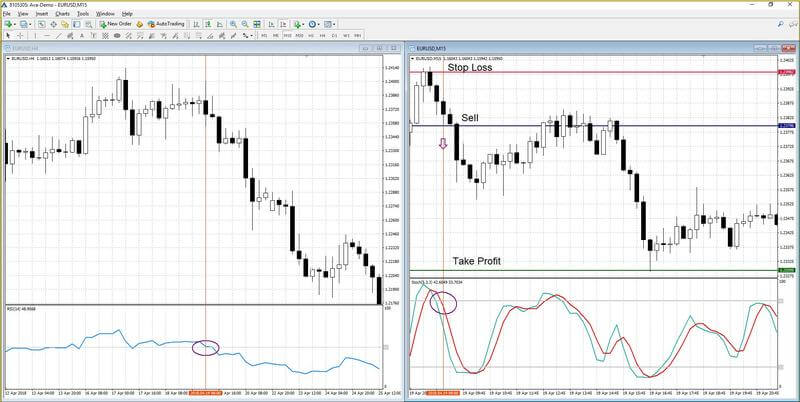
Long positions (Buy) will be opened in the opposite case. Stop Loss and Take Profit are fixed and set at distances 20 and 50 points from the opening price respectively. Such ratio enables to obtain a positive statistical expectation from trading in the long run. It is recommended to check the economic calendar before opening positions in this trading system since the release of important news can significantly influence price movement, and technical analysis won’t be relevant at this very moment.
Finally, let’s consider strategy with three classic indicators filtering each other as a single set and giving powerful signals for entering the market. This strategy fits best for trading on Н1, Н4 and D1.
First, it is necessary to set up the following indicators in the chart:
According to this strategy, a long position is opened when the following signals are generated:
All three signals should be received during three candles, otherwise, they will lose their value.
Short positions (Sell) should be opened in the opposite case. Exiting an open trade should be done when RSI enters the opposite zone. Sometimes, an opposite position can be opened simultaneously with closing previous position, granting other signals to follow the aforementioned pattern.
Once you’ve mastered the basics of using RSI to identify overbought/oversold levels and divergences, you can enhance your trading by combining RSI with other technical indicators and exploring more nuanced strategies. Here are a few advanced techniques to elevate your RSI trading strategy.
While RSI is effective on its own, it becomes even more powerful when combined with other indicators like the Moving Average Convergence Divergence (MACD) and moving averages.
Just as you would draw trendlines on price charts, you can apply the same technique to the RSI itself to track momentum trends.
In volatile markets, managing risk is critical to protecting your capital. RSI can help with risk management by:
Trading with RSI can be profitable, but it’s essential to manage your risks properly, especially in volatile markets. Here are some simple ways to use RSI while minimizing risks:
The RSI is a great tool, but it’s not foolproof. Don’t base your trading decisions solely on the RSI signals. Always confirm with other indicators like moving averages or support and resistance levels. This helps filter out false signals and improves your chances of success.
Always use a stop-loss when entering a trade. If you are using the RSI to identify a buying opportunity during an oversold condition, place a stop-loss just below the recent price low. This way, if the trade goes against you, you will limit your losses.
The RSI works best in range-bound markets, but it can give false signals during strong trends. Be mindful of the market conditions and adjust your expectations accordingly. In trending markets, the RSI can stay in overbought or oversold territory for longer periods, so combining it with trend-following tools can help.
The Relative Strength Index, or RSI, is used to locate overbought and oversold conditions in financial markets. As an oscillator type indicator it does this by moving up and down within a range of 0 to 100, with 0 representing the most oversold conditions, and 100 representing the most overbought conditions. Typically any reading above 70 is considered overbought and ripe for a reversal, while readings below 30 are considered oversold and also ripe for a reversal. Some traders use the 80 and 20 levels as their signal points.
Because the RSI is typically used to detect overbought and oversold markets some traders feel it can’t be used in a trending market, but nothing could be further from the truth. One RSI trading strategy used in trending markets would be to wait for the indicator to signal an overbought condition during an uptrend. The trader then waits for RSI to drop below 50, which signals a long entry. If the trend remains in place price will typically recover off this level and move to new highs.
Using divergences between the RSI and prices on the chart is considered as an aggressive use of RSI, but it also allows trends to be discovered early, thus leading to greater profits. For example, in a downtrend we might see lower bottoms for prices, but higher bottoms on the RSI. This indicates the strength and momentum of the downtrend is decreasing, which makes an upturn in price more likely. The same is true in an uptrend, although there we would see lower highs in the RSI, while higher highs are still being reached on the price chart.
The Relative Strength Index (RSI) is a versatile and powerful tool that can help traders at all levels make smarter, more informed trading decisions. Whether you’re using it to spot overbought and oversold conditions, identify divergences, or enhance your strategy with advanced techniques, the RSI offers valuable insights into market momentum. However, always remember to use the RSI alongside other indicators and apply proper risk management to maximise your success and minimise potential losses.
Ready to put these RSI strategies to the test? Open a Demo account to practice risk-free!
Trading in financial markets puts your capital at risk. It is recommended to accurately follow the money management rules and always set Stop Losses to reduce risks. This article doesn’t constitute an investment/trading advice. We recommend you to visit our trading for beginners section for more articles on how to trade Forex and CFDs.
Technical Analysis Indicators & Strategies • 13 min

Technical Analysis Indicators & Strategies • 13 min

Technical Analysis Indicators & Strategies • 12 min

Technical Analysis Indicators & Strategies • 15 min

Technical Analysis Indicators & Strategies • 10 min

Technical Analysis Indicators & Strategies • 11 min

Technical Analysis Indicators & Strategies • 15 min

Technical Analysis Indicators & Strategies • 13 min

Technical Analysis Indicators & Strategies • 15 min

Technical Analysis Indicators & Strategies • 15 min

Technical Analysis Indicators & Strategies • 13 min

Technical Analysis Indicators & Strategies • 12 min

Technical Analysis Indicators & Strategies • 11 min

Technical Analysis Indicators & Strategies • 13 min

Technical Analysis Indicators & Strategies • 20 min

Technical Analysis Indicators & Strategies • 10 min

Technical Analysis Indicators & Strategies • 13 min

Technical Analysis Indicators & Strategies • 18 min

Technical Analysis Indicators & Strategies • 8 min

Technical Analysis Indicators & Strategies • 12 min