

Meme Stocks
Market Terms • 18 min
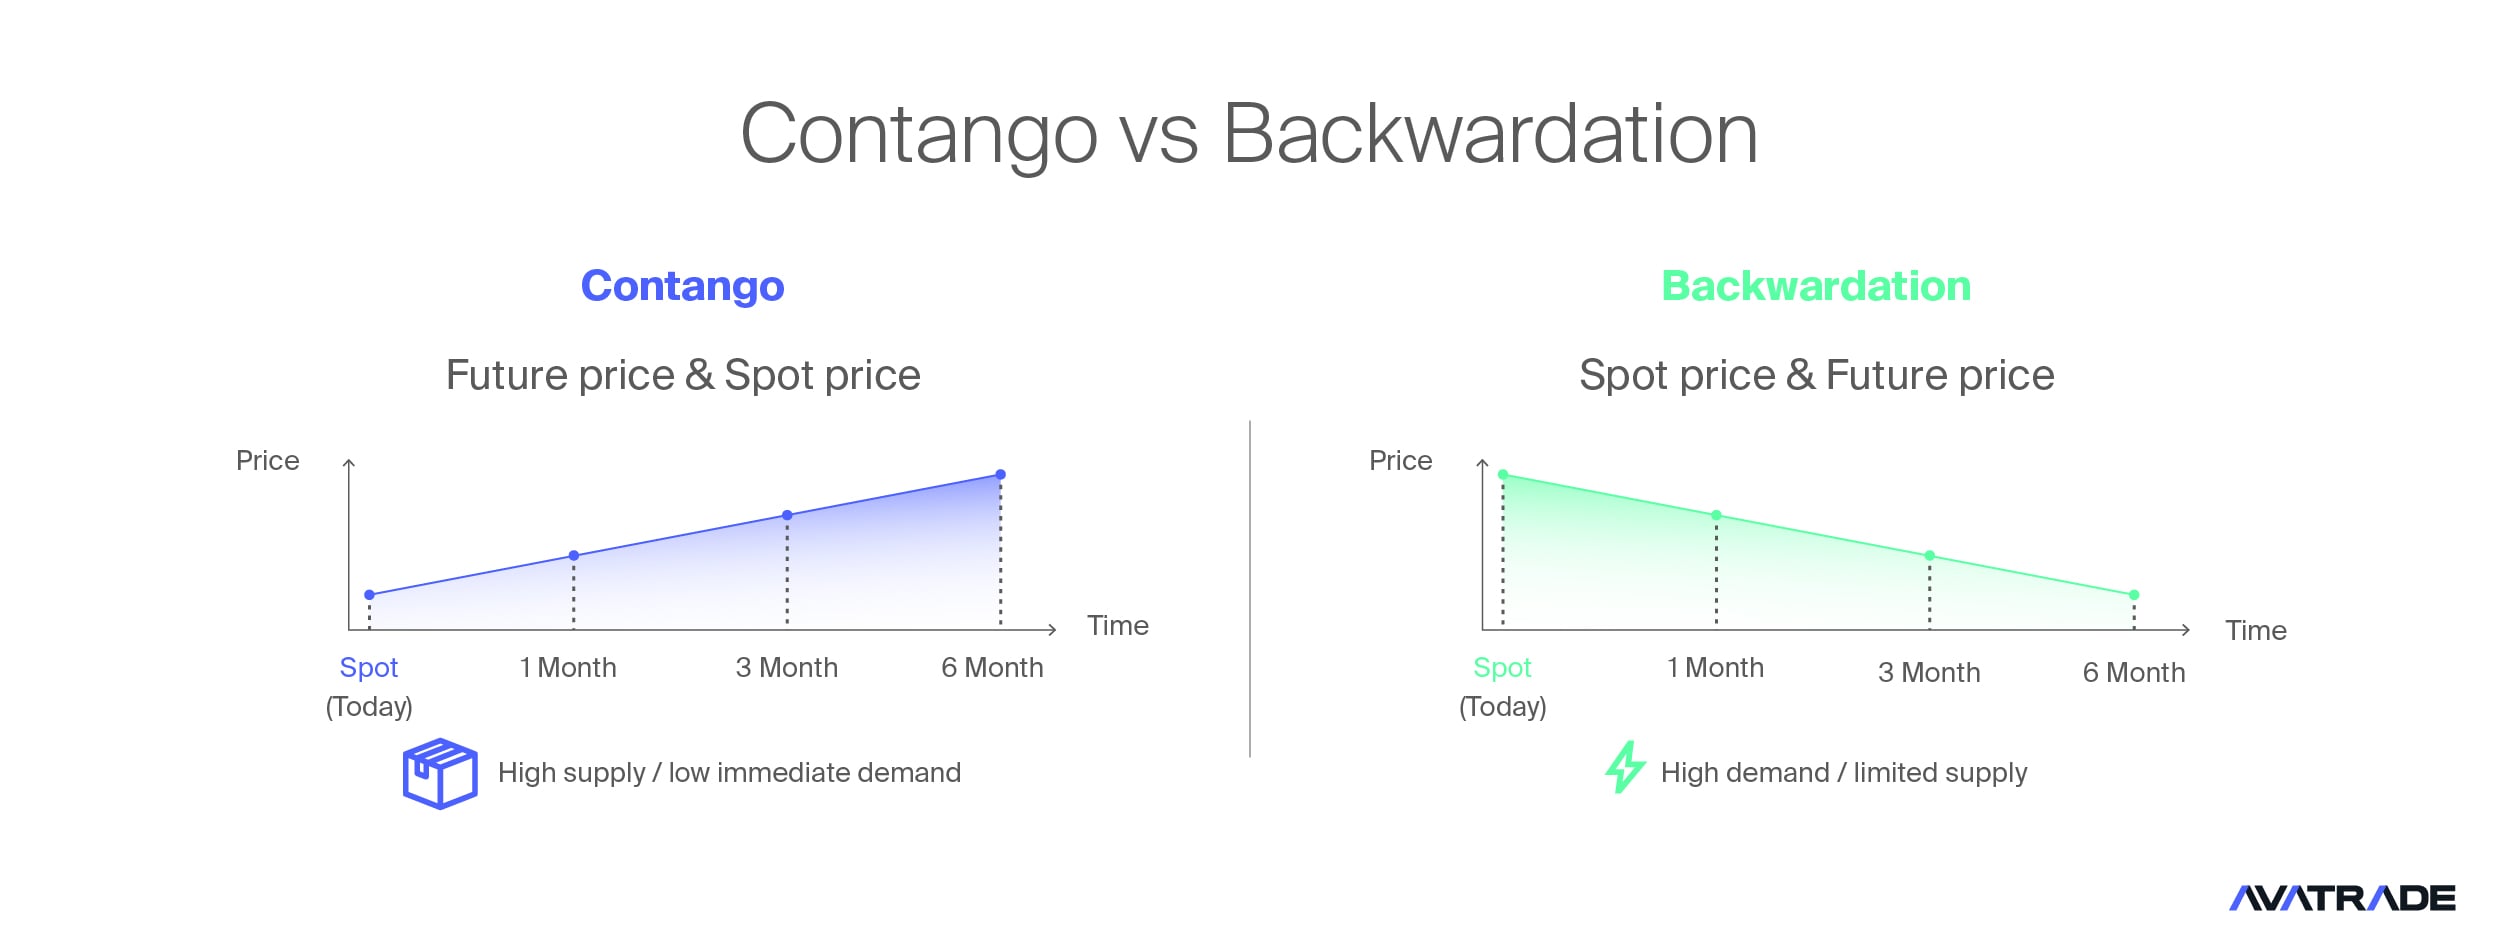
Contango is when a futures contract trades above the current (spot) price for the same asset and delivery date, producing an upward-sloping term structure.
It typically occurs when the cost of carry (financing, storage/insurance, or foregone income) exceeds any convenience yield or cash flows from holding the asset.
Why it matters:
Term structure
The shape of futures prices across different expiries for the same asset (e.g., 1-month, 3-month, 6-month). Upward-sloping implies contango; downward-sloping implies backwardation.
Basis
Futures price minus spot price for a given expiry. A positive basis (futures > spot) is contango; a negative basis is backwardation. Basis tends to shrink towards zero as expiry approaches.
Convenience yield
The non-cash benefit of holding the physical asset (e.g., assured supply, ability to meet urgent demand). High convenience yield can offset storage/financing costs and flip the curve into backwardation.
Roll yield
The gain or drag from rolling a futures position from a near contract into a later one. In contango, longs usually pay to roll (negative roll yield); in backwardation, longs may earn roll yield.
Calendar spread
A trade that buys one expiry and sells another (e.g., long near, short far). It isolates the curve shape rather than outright price direction.
Open a free demo account to practise reading and trading term structures.
Owning a futures-based exposure is not the same as owning the spot asset. Your total return comes from three parts:
Many commodity and volatility ETFs gain exposure via front-month futures that are rolled on a schedule.
In contango, the next contract is more expensive than the one you sell, so you “trade up the curve” and lose value on each roll—even if spot is flat.
Open a free demo account to see how roll schedules affect returns in practice.
Fair value reflects financing minus dividends over the life of the contract.
Driven by interest-rate differentials (covered interest parity). The currency with the higher policy/market rate tends to trade at a discount forward versus the lower-rate currency. Depending on the pair and quote convention, that can look like contango or backwardation, but it’s carry, not a price forecast.
Implied carry comes from repo/financing and the cheapest-to-deliver dynamics in deliverable contracts.
Curve shape can reflect funding conditions and delivery options rather than a directional call on yields.
Often show persistent contango in calm markets (near-dated lower than far-dated due to mean-reversion expectations).
Systematic rolling of long exposure can incur significant negative roll yield; during stress, curves can flip to backwardation abruptly.
“Contango” across assets is the price of carry, not a bullish/bearish signal by itself. Strategy edges come from understanding the inputs to carry (rates, dividends, storage, convenience yield), the roll schedule, and the curve’s slope.
Open a free demo account to compare carry effects across indices, FX, rates and volatility.
A quick checklist to turn a curve into actionable insight.
Futures curves often reflect seasonal supply and demand, so shape changes can be predictable—even if prices aren’t.
Practical note: Seasonality offers context, not a trading signal. Treat it as a prior; then test today’s inventories, policy path, weather, and positioning to confirm.
Open a free demo account to explore seasonal curve shifts in a risk-free environment.
“Contango Means Prices Will Rise.”
False. Contango reflects carry costs exceeding convenience yield/income, not a directional view on spot. Prices can fall in contango and rise in backwardation.
“Backwardation Is Automatically Bullish.”
No. It signals near-term tightness or high convenience yield. Spot can still decline if demand softens or supply normalises.
“Futures ETFs Track Spot Perfectly.”
Not in persistent contango/backwardation. Roll yield—positive or negative—creates a gap between ETF returns and spot moves.
“Roll Yield Is Just Noise.”
It compounds. A small monthly roll drag can turn into a material annual performance gap.
“All Assets Show Contango the Same Way.”
They don’t. Drivers differ: storage/insurance (commodities), dividends/financing (equity indices), rate differentials (FX), repo/CTD (rates), term premium (volatility).
Leverage magnifies carry and roll effects—not just price moves—so contango/backwardation can dominate P&L over time.
CFD funding (longs typically pay, shorts may earn or pay depending on rates and borrow) stacks on top of the curve carry. Know your product’s rate base, spread, and when funding is applied.
If the provider auto-rolls, your position inherits the near-to-next price gap. In contango, that can be a recurring drag for longs; in backwardation, a tailwind. Check roll timing, methodology, and any cash adjustments.
Front contracts are usually deepest; far-dated months can be thinner. Around roll windows and events, spreads can widen and slippage can rise, especially for larger or leveraged positions.
Ensure your CFD tracks a specific futures contract or a continuous index—and understand how that index is constructed (front-only, staircase, or blended). Mismatches create basis risk versus your thesis.
Use position sizing, stop-losses, and time stops tailored to expected roll drag/benefit. Scenario-test a steeper or flatter curve, not just a move in spot.
Open a free demo account to practise managing roll and funding risks.
** Disclaimer – While due research has been undertaken to compile the above content, it remains an informational and educational piece only. None of the content provided constitutes any form of investment advice.
Check the near versus next futures prices for the same asset. If the next contract is higher, the curve is upward-sloping (contango).
Because rolling from a cheaper near contract into a pricier next one creates negative roll yield, which drags returns over time.
Neither. It reflects carry conditions (financing, storage, dividends, rates), not a forecast for spot direction.
Backwardation is a downward-sloping curve (futures below spot), often linked to near-term tightness or high convenience yield; rolling can add to long returns.
Yes—via different drivers: dividends vs financing (equity indices), interest-rate differentials (FX), and repo/CTD dynamics (rates).
Market Terms • 18 min

Market Terms • 8 min

Market Terms • 10 min

Market Terms • 11 min

Market Terms • 11 min

Market Terms • 11 min

Market Terms • 13 min

Market Terms • 12 min

Market Terms • 10 min

Market Terms • 17 min

Market Terms • 11 min

Market Terms • 10 min

Market Terms • 10 min

Market Terms • 14 min

Market Terms • 13 min

Market Terms • 13 min

Market Terms • 9 min

Market Terms • 6 min

Market Terms • 6 min

Market Terms • 13 min